PODDS in Valencia by Dr Stewart Husband
This the article written by Dr Steward Husband from Sheffield University.
Introduction
Drinking water distribution systems support a diverse microbial community attached to the pipe walls forming biofilms that entrain inorganic and organic components. If the hydraulic conditions in the distribution network increase and overcome biofilm adhesive forces, biofilms can detach from the pipe walls, creating discoloured water plus taste and odour and other water safety issues. A trial from Valencia in November 2019 highlights the predictable patterns in behaviour and highlights how hydraulic network management can be used as a control measure.
Fieldwork
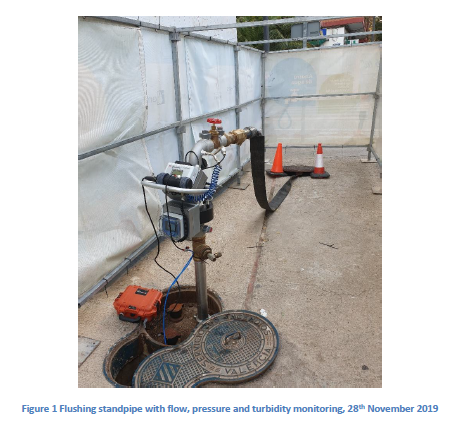
A standpipe with incorporated hydraulic (pressure and flow, www.langhamcontrols.com) and water quality (turbidity, http://www.atiuk.com) was connected via fittings (www.greiner.it) to a hydrant linking a 100mm diameter section of AC pipe within Valencia. This was then subjected to controlled flow increases and the impact recorded (flow and pressure 15 second logging, turbidity 1 second logging). The equipment and equipment is shown in Figure 1.
Results
The trial flow, pressure and turbidity results are shown in Figure 2. Five aspects of the results are highlighted with explanations focussing on the turbidity response to the imposed hydraulics;
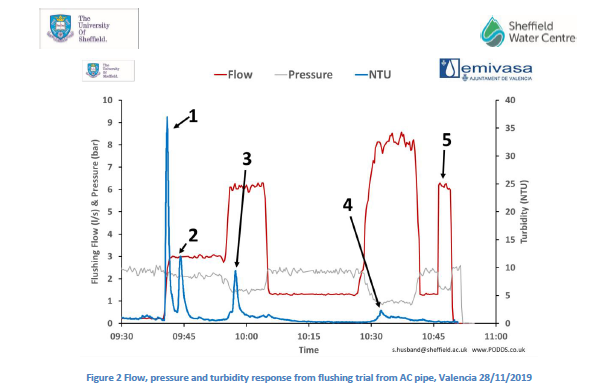
- With initial flow increase there is a short duration, but high turbidity response. This is typically observed during flushing and is associated with material being removed from the hydrant and connecting pipework.
- A classic turbidity response profile representing material (biofilms and associated material) being removed from pipe walls. In this case, with a flushing flow of 3 l/s in a 100 mm diameter pipe and a peak after 1 minute, it indicates a pipe length of around 25m not conditioned to flows of this magnitude (see www.PODDs.co.uk for an explanation of this behaviour).
- A further increase in flow (up to 6 l/s) results in an additional mobilisation of higher shear strength material (note the same profile response, but shorter turbidity response due to higher flushing flow rate). It should also be noted that the higher flow also has an impact on additional lengths of upstream pipe not seen previously with turbidity taking longer to return to background levels.
- A further (but smaller) increase in flow (up to 8 l/s), limited in this case to maintain system pressure1 of at least 1 bar, and a further mobilisation of material, with both initial and upstream pipe lengths again effected. Note how material is not mobilised until the previous flow rate is exceeded.
- Following a reduction in flow rate, flow is rapidly increased to levels previously attained, yet this time no turbidity response is observed. This represents evidence that the pipe has now been “conditioned” and therefore no mobilisation risk is now present2 for flows up to this value. This highlights how hydraulic management can be used to control water quality risk.
- Flow and pressure data facilitates calibration for hydraulic modelling, including roughness and leakage evaluation.
- The water quality risk will return, research has shown this is a function of supplied water quality and time since hydraulic intervention, www.PODDS.co.uk.